Description
A visual style guide is the first step to go from good BI to great BI. It’s also the missing link in most business intelligence projects. When you work on any visual platform having a guide with parameters, styles, assets, rules and examples is key to a smooth process and a clear style. Add to that the complexity of conveying story with data or using the interface to show complex systems, then without a guide, it means that there is no consistency.
What’s included in your Power BI Style Guide?
Designing a Dashboard
Multiple pages linking the latest in design research with methods of applying it to your design.
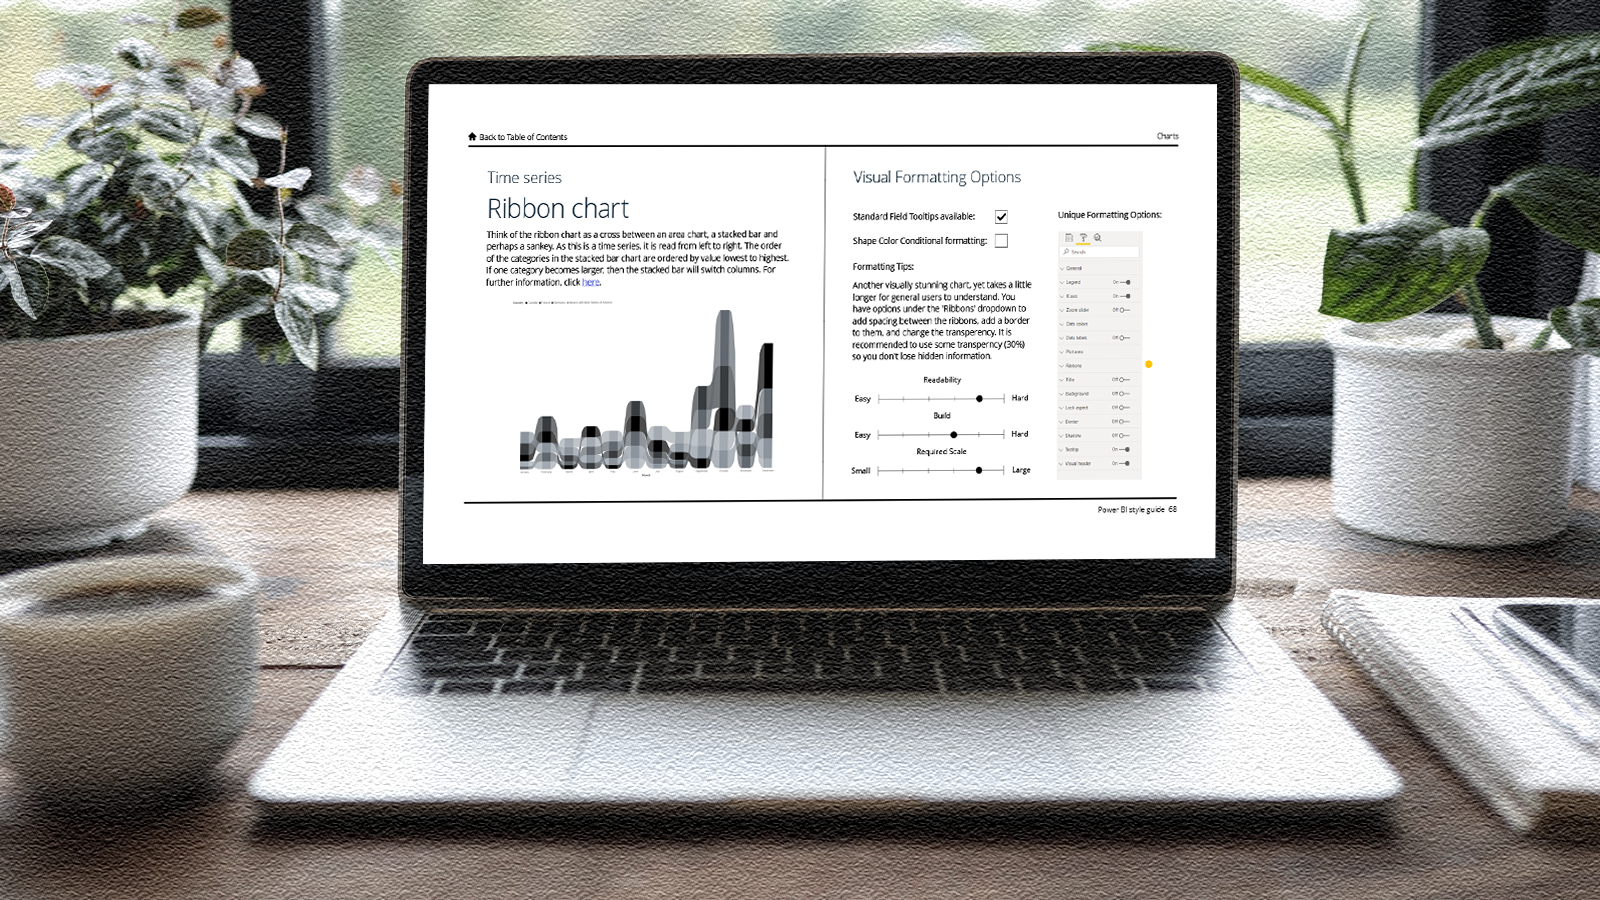
Charts
Each chart is presented with a design best practice example and content to understand and use them effectively.
Templates
Alongside your style guide, you will be given templates and frameworks to get you moving immediately in the right direction.
Styling
On brand design rules your company can follow to ensure unified designs. Think typography and color.
Instructions
Step by step instructions to limit technical challenges and allow your team to focus more on the design.
Extra
The list goes on. Request extras with your style guide such as icon sets, design examples, and source files to name a few.


