An Introduction to Data Visualization and Storytelling

$189 +GST

This course has been designed as the foundation of any future courses on the platform. If you work with data, we guarantee you’ll get something out of this. Whether you’re a marketer, designer, web developer, data analyst, public servant, corporate team member or otherwise, you’ll be able to take away practical skills to better communicate data in your day-to-day.

● It’s built for EVERYONE

● You don’t need to be a data viz software wiz

● You don’t need to be a designer

● You DO have the time – complete the course in as little as 10 hours

● Learn on the go – whenever and wherever you have an internet connection

Category:

Description

‘AN INTRODUCTION TO DATA VISUALIZATION AND STORYTELLING’ COURSE OUTLINE:

Intro to Data Visualisation – Learn the foundations of what data visualization is, how it came to be and how it’s used most effectively. Plus, get acquainted with the industry terms and understand the role of design thinking in data visualization.

Common Charts – Learn how to choose the right chart for your data and get to know with best practices for chart design and iterative design processes.

Data Visualisation Processes – Learn the holy grail of running a successful data viz project. We break down our tried and tested processes in a step-by-step format while providing tips, checklists and more so you can run a full data viz project with confidence.

From Data to Storytelling to Design – Put it all together and learn how to find the stories buried in your data cells, and how to transform this into an engaging and memorable visual output. We’ve jammed this chapter with loads of practical information-design tips that you can start using immediately.

Advanced Visualizations – Learn how to tackle multi-variable data and present it clearly. We’ll touch on dashboards, infographics, web and interactive experiences and more.

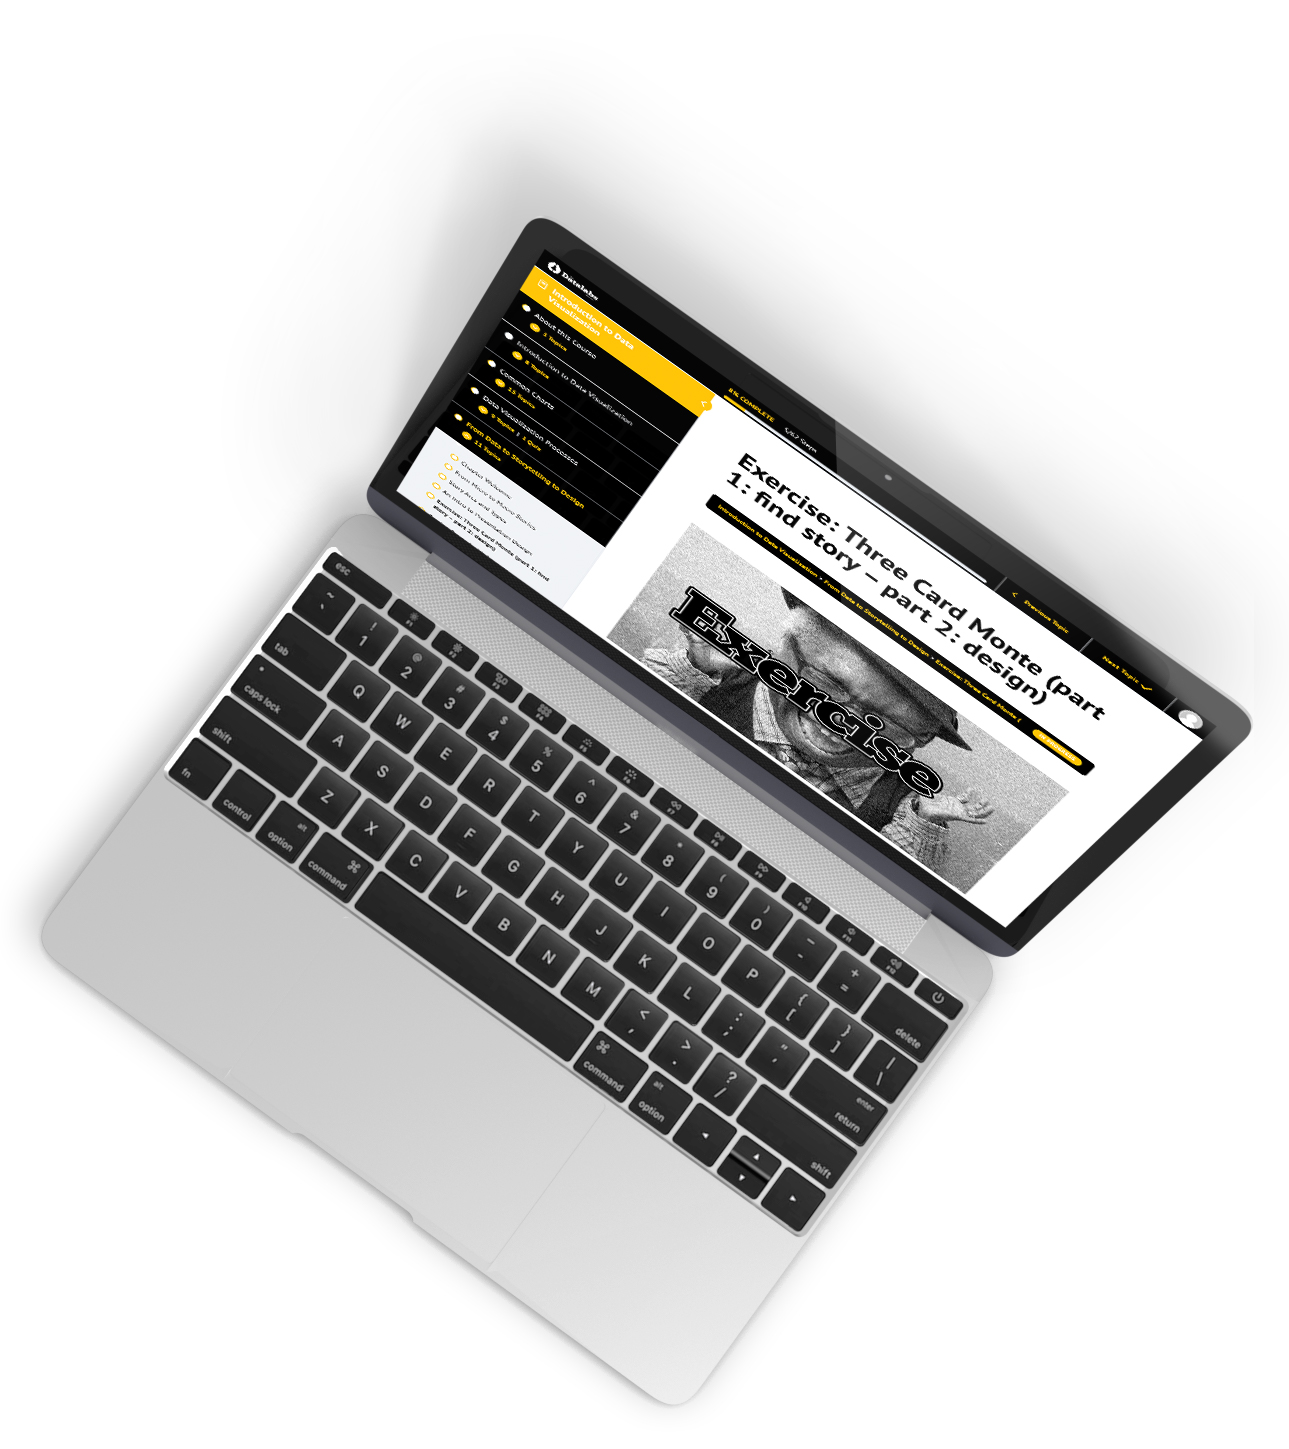
Data Viz Inspiration and Resources – Don’t stop here. Find out where to go next to continue learning, creating and gathering feedback. See who does it best and get inspired to push your own data viz designs even further.