


AGM Presentations That Don’t Suck
The Best AGM Presentations
Whether it be for shareholder relations, membership associations, chairpersons or a mix of everyone – Annual General Meetings exist to flaunt your company’s operations as best you can (while being transparent, of course). It’s also one of the best chances you can get to really engage with your audience and hopefully inspire new potential investors or donors.


So why do so many AGM presentations suck?
To be fair, there can be a number of reasons why organizations end up presenting sucky AGMs.
Time
Typically, if you’re the type of organization that holds AGMs or Shareholder Relations Meetings, you may not have all the time in the world to create the magical experience you really want for your audience. It happens. And in a lot of cases, the data you’ll be presenting isn’t released until 24-48 hours before the meeting will be held. To top it off, that data is usually highly sensitive until it’s showcased in your corporate presentation.
Lack of Resources
(And you could be lacking quite a few…) If you’re running an AGM, you should have your financial data in order as, in most cases, it’s compulsory. But that doesn’t mean your presentation is done. A compelling presentation tells a visual story with its data – meaning both the content and visuals are interesting and easy to follow. Perhaps your organization doesn’t have a data analyst or data communications specialist to understand and then script your data into a spellbinding story. Perhaps you can’t spare a graphic designer – or motion graphic designer – to turn that data script into something visually awe-inspiring for your audience.
“It’s Always Been Done This Way”
Cool attitude… But ever heard of progress or innovation? Don’t worry – we can understand why you’d want to keep it in the same format. Most organizations’ AGMs will follow the same format (and same agenda) as their last AGM. It’s a repetitive process, just with new data and information. But given that you could virtually use a template for each meeting (and change up some of the inner pieces, of course), wouldn’t it make sense to upgrade that ‘template’ into the 21st century and be able to use it from then on?
The Negative Perception of the Meetings
Another reason why your AGM presentation may be lacking love is that the people responsible for creating the presentation (or even the people who are delegating the presentation creation) have a negative perception of AGMs. They may not think they’re worthwhile or not worth the effort – but rather, just another compulsory task. Basically, they don’t understand the opportunity they have in front of them to make their AGM worthwhile. AGMs must obviously be factual and informative. But the reality is, they’re also a huge marketing opportunity. Think about it – you have all your investors and stakeholders in one room. The presentation itself is likely required to be released publicly after the meeting (hello, new investors!). And, depending on your organization and its circumstances, this information is interpreted by the media and then reflected in the media. Talk about targeted marketing. Make your impressions count.
Presentations Shouldn’t Be Boring
It’s a given – you’re going to have to talk about some things that may not be very exciting. Really, you’re presenting and summarizing an annual report in many cases. But that doesn’t mean your PowerPoint slides should look like this:

There are plenty of exciting ways to present your organization’s story over the last year in a corporate meeting. And if you want to really make the most out of your AGM or Shareholder Relations Meeting, then you need to make it stand out. Here are just a few ideas…
Creative Ideas for Making a Stand-out AGM Presentation
Start by Revamping Your PowerPoint Presentation Slides and Template.
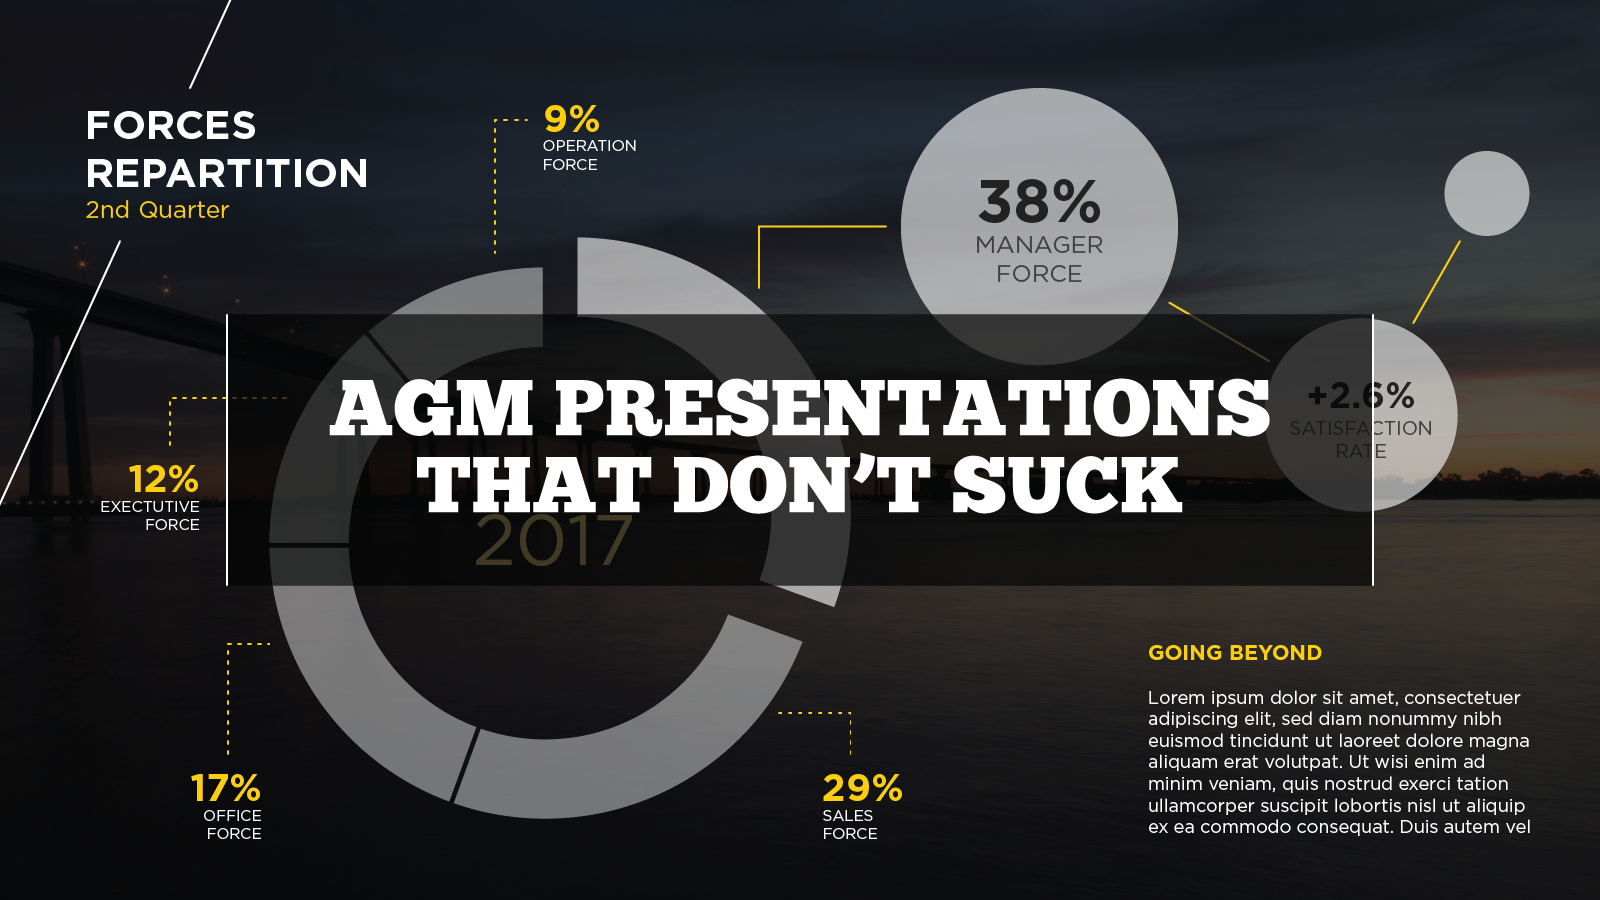
This is one of the simplest ways to enhance your presentation, and it can be reused in the future, too. If you’re serious about it, try not to give it to your intern. You may have an in-house graphic designer. If not, consider investing in an experienced contractor. Preferably someone with data design experience, so you can get some slide templates included. Here’s a good example:


Make It Visual – It’s a Presentation After All
Add more graphics to your presentation that are interesting and relevant. Don’t just present text. Add some icons as a minimum. Visualize your data meaningfully, rather than overwhelming your audience with hideous tables and over-complicated pie charts. Don’t forget – there’s usually your keynote speaker standing at the front reading the information out to everyone anyway. Do you really want the slides to be the same exact text as the speech? It makes either the presenter or the presentation slides redundant and it’s woefully boring.
Mix Up Your Presentation Formats – Try Video and Animation Features.
Break up dense topics (and your corporate presentation as a whole) by incorporating video, animation, infographics, and other media. If you don’t have the largest budget, consider a data-driven introductory video about your organization that can be reused in other presentations and on social media. That way, you can get the most bang for your buck. A great example of this is Coca-Cola Amatil’s 2016 AGM Video.
If you’re AGM or Shareholder Relations Meeting is going to be a particularly  a long one, try adding different media formats in various sections of your presentation.
One engaging infographic for each chapter, maybe? Something you can share on your website or social platforms as well even?
Make a Story Out of One of Your Projects.
This leads to the last point. What project did your organization undertake that made a difference in the year? Rather than just present the boring ‘money-in, money-out’ figures, engage your audience by inviting them into the organization’s inner workings. Make them feel involved by humanizing the project with a quirky animation or slideshow of images and well-designed data visualizations. Figure out your story and decide on the best presentation format so you can feature your project and hold on to your audience’s attention spans.
Feature a guest speaker.
Think a little more outside the box and get someone from your own organization (or a thought leader from one of your providers, perhaps) to talk about either current or future projects and goals.
Conclusion About AGM Presentations
Annual general meetings and shareholder relations meetings (and other corporate meetings) are more than just a mandatory reporting exercise. They are growth opportunities, marketing, and PR opportunities, and opportunities to innovate your organization. And if you truly want to show that your organization is cutting-edge, a PowerPoint that looks like it’s been made by a 3rd-grader isn’t going to cut it. Of course, even after reading this, you could still inevitably be held up by the reasons we listed above for not being able to deliver a quality presentation.
So, alleviate your worries. Find a reliable and experienced agency who can:
.We are the Datalabs Agency – get in touch about AGM presentations (and other data presentations) that don’t suck.
Ready to revamp your Annual General Meetings?
Get in touch with us directly by emailing hello@datalabsagency.com
to talk about your needs and find out how we can get it sorted.
Or click the Contact Us link in the navigation.